Cannabis Product Potency Explained: Complete 2025 Guide
Understanding cannabis product potency is essential for making informed decisions about consumption. Potency refers to the concentration of active cannabinoids like THC and CBD in cannabis products, measured as percentages. This comprehensive guide explains how total cannabinoids percentage affects your experience, dosing considerations, and the latest 2024-2025 regulations across the United States.
What Does Cannabis Product Potency Mean?
Cannabis product potency represents the concentration of active compounds, primarily tetrahydrocannabinol (THC) and cannabidiol (CBD), expressed as percentages by weight or volume. In 2024, most U.S. dispensaries display potency levels ranging from 10% to 35% for flower products, while concentrates can reach 80-95% THC. The total cannabinoids meaning encompasses all active compounds including THC, CBD, CBG, CBN, and other minor cannabinoids that contribute to the overall effect.
Understanding potency helps consumers predict effects and determine appropriate dosing. A cannabis product with 20% THC contains 200 milligrams of THC per gram of material. Federal testing requirements mandate that all licensed cannabis products display accurate potency information, ensuring consumer safety and informed decision-making across legal markets.
Total Cannabinoids Percentage and Testing Standards
The total cannabinoids percentage includes all active compounds measured during laboratory testing, providing a comprehensive picture of product strength. In 2024, state-licensed laboratories use high-performance liquid chromatography (HPLC) to measure cannabinoid concentrations with accuracy requirements of ±10% variance. This testing reveals not just THC and CBD levels, but also minor cannabinoids that contribute to the entourage effect.
Current U.S. testing standards require analysis of at least 12 different cannabinoids, including Delta-9 THC, THCA, CBD, CBDA, CBG, CBN, and CBC. The cannabinoid potency chart displayed on product labels shows both individual compound percentages and total active cannabinoids, helping consumers understand the full spectrum of effects they can expect from each product.
Understanding THC vs THCA in Potency Measurements
Many consumers misunderstand the difference between THC and THCA when reading cannabis product potency labels. THCA (tetrahydrocannabinolic acid) is the non-psychoactive precursor that converts to psychoactive THC through decarboxylation via heat. Raw cannabis flower contains primarily THCA, which transforms to THC when smoked, vaped, or cooked, affecting the actual total cannabinoids percentage experienced by users.
CBD Potency and Non-Psychoactive Cannabinoids
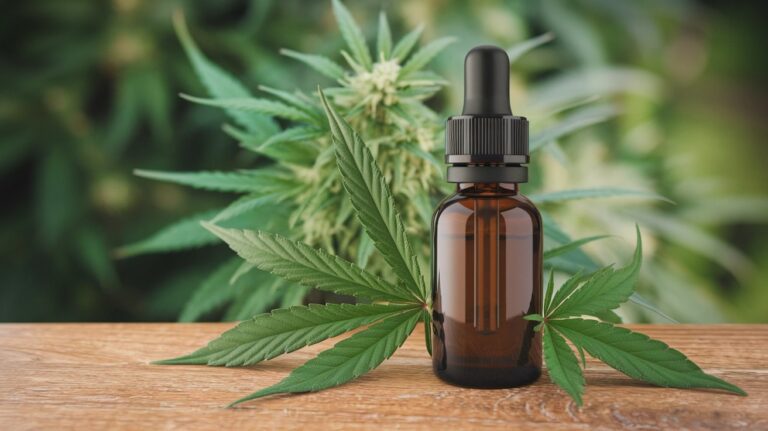
CBD potency measurements are crucial for therapeutic users seeking specific medical benefits without psychoactive effects. High-CBD cannabis products typically contain 10-20% CBD with minimal THC content below 0.3% to comply with federal hemp regulations. The cannabinoid potency chart for CBD products also includes CBG, CBN, and other compounds that enhance therapeutic effects through synergistic interactions.
Forms of Cannabis and Their Potency Variations
Different forms of cannabis exhibit varying potency levels due to processing methods and concentration techniques. Flower products typically range from 15-30% total cannabinoids, while concentrates like shatter, wax, and live resin can exceed 70-90% potency. Edibles present unique challenges because the total cannabinoids meaning includes both active and inactive forms that metabolize differently through the digestive system.
In 2024, new extraction technologies have enabled precise potency control across all cannabis products. Distillates offer nearly pure cannabinoid content at 90%+ potency, while full-spectrum extracts maintain natural terpene profiles with moderate potency levels of 60-80%. Understanding these variations helps consumers select appropriate products based on desired effects and experience level.
Flower Products and Natural Potency
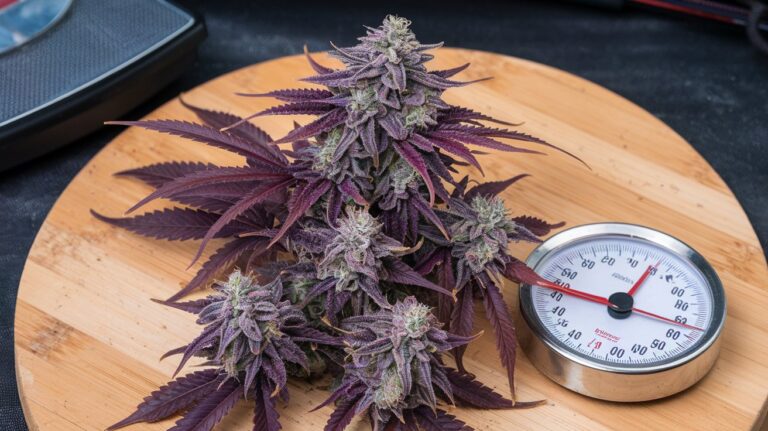
Cannabis flower represents the most traditional form with naturally occurring cannabis product potency determined by genetics, growing conditions, and harvest timing. Premium indoor-grown flower in legal U.S. markets averages 20-25% THC, while outdoor varieties may range from 12-18%. The total cannabinoids percentage in flower includes naturally preserved terpenes and minor cannabinoids that contribute to strain-specific effects.
Concentrate Potency and Extraction Methods
Cannabis concentrates achieve higher total cannabinoids percentage through various extraction methods including CO2, butane, and rosin pressing. Live resin concentrates preserve terpenes while achieving 70-85% potency, while distillates focus purely on cannabinoid concentration reaching 90%+ purity. Each extraction method affects the final cannabinoid potency chart and overall product effects.
How Potency Influences Cannabis Effects
Higher cannabis product potency doesn’t always translate to better effects, as the relationship between potency and experience follows a complex dose-response curve. Research from 2024 indicates that optimal effects often occur at moderate potency levels of 15-25% THC, with diminishing returns and potential adverse effects at higher concentrations. The total cannabinoids meaning extends beyond just THC percentage to include the full spectrum of compounds that modulate effects.
Individual tolerance, consumption method, and cannabinoid ratios significantly impact how potency affects users. A cannabis product with 30% THC may produce overwhelming effects for novice users, while experienced consumers might require such concentrations for therapeutic benefits. Understanding personal tolerance and starting with lower potency products remains the safest approach for new consumers.
Bioavailability and Potency Relationship
Bioavailability dramatically affects how cannabis product potency translates to actual effects in the body. Smoking and vaping offer 15-30% bioavailability, meaning only a fraction of the listed total cannabinoids percentage reaches the bloodstream. Edibles have lower bioavailability at 4-12% but produce longer-lasting effects due to liver metabolism creating the more potent 11-hydroxy-THC compound.
Sublingual tinctures and oral sprays provide improved bioavailability of 20-35% compared to traditional edibles, making potency calculations more predictable. Understanding these differences helps consumers adjust dosing based on consumption method and desired cannabinoid potency chart effects. Factors like empty stomach consumption, individual metabolism, and product formulation all influence how potency translates to experienced effects.
Factors That Enhance Cannabis Bioavailability
Consuming cannabis products with healthy fats increases bioavailability by improving cannabinoid absorption. Foods like coconut oil, nuts, and avocados can enhance the effectiveness of edible products, making lower potency options more effective. The total cannabinoids percentage becomes more bioavailable when combined with these natural potentiators, allowing users to achieve desired effects with less product.
Timing and Metabolism Considerations
Individual metabolism rates significantly affect how cannabis product potency translates to actual effects. Fast metabolizers may require higher potency products to achieve therapeutic benefits, while slow metabolizers should start with lower concentrations. Age, body weight, liver function, and concurrent medications all influence how the body processes cannabinoids from the cannabinoid potency chart.
Choosing the Right Potency for Your Needs
Selecting appropriate cannabis product potency requires careful consideration of experience level, therapeutic goals, and consumption preferences. Beginners should start with products containing 5-10% THC or high-CBD options with minimal psychoactive effects. The principle of “start low and go slow” remains the gold standard for safely exploring forms of cannabis while avoiding overwhelming experiences.
Experienced users seeking specific therapeutic effects may require higher potency products, but should consider the full total cannabinoids meaning rather than focusing solely on THC percentages. Medical patients often benefit from balanced ratios like 1:1 THC:CBD or high-CBD products with 15-20% cannabinoid content. Consulting with knowledgeable budtenders and reviewing detailed cannabinoid potency charts helps ensure optimal product selection.
Legal Potency Limits Across U.S. States
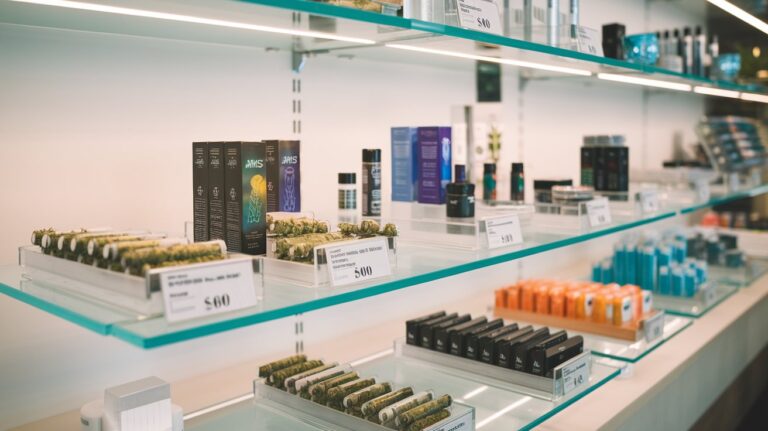
State regulations establish maximum potency limits for different cannabis products sold in legal markets throughout the United States. As of 2024, most states cap flower products at natural potency levels without artificial limits, while concentrates face restrictions ranging from 70% to unlimited depending on jurisdiction. Edibles typically have strict THC limits of 5-10mg per serving and 50-100mg per package to prevent overconsumption.
Colorado maintains some of the most comprehensive potency regulations, requiring special packaging and consumer warnings for concentrates exceeding 35% THC. California allows unlimited potency for concentrates but mandates detailed cannabinoid potency chart labeling and child-resistant packaging. These varying regulations create different market standards for total cannabinoids percentage across legal states, affecting product availability and consumer choice.
Quality Control and Potency Accuracy
Ensuring accurate cannabis product potency labeling requires rigorous quality control measures throughout the supply chain. Licensed testing laboratories must maintain ISO/IEC 17025 accreditation and participate in proficiency testing programs to verify measurement accuracy. Batch testing occurs at multiple stages, from harvest to final packaging, ensuring the total cannabinoids percentage matches labeled claims within acceptable variance limits.
Consumer protection agencies in legal states conduct regular compliance testing, with penalties for products exceeding 15% variance from labeled potency. Some states require third-party verification of all cannabinoid potency chart data before products reach retail shelves. These quality control measures have significantly improved product consistency and consumer confidence in legal cannabis markets across the United States since 2020.
Related video about cannabis product potency explained
This video complements the article information with a practical visual demonstration.
Your questions answered
What does total cannabinoids percentage mean on cannabis products?
Total cannabinoids percentage represents the combined concentration of all active compounds including THC, CBD, CBG, CBN, and other minor cannabinoids present in the product. This measurement provides a comprehensive view of the product’s overall potency and potential effects, going beyond just THC or CBD content to include the full spectrum of therapeutic compounds.
How do I choose the right cannabis product potency for beginners?
Beginners should start with low-potency products containing 5-10% THC or high-CBD options with minimal psychoactive effects. Start with the smallest recommended dose and wait at least 2 hours before consuming more. Consider balanced THC:CBD ratios like 1:1 for gentler effects and always purchase from licensed dispensaries with accurate potency labeling.
Why do different forms of cannabis have varying potency levels?
Different cannabis forms achieve varying potency through processing methods and extraction techniques. Flower products contain natural cannabinoid concentrations of 15-30%, while concentrates use extraction methods to achieve 70-95% potency. Edibles require precise dosing due to different metabolism and bioavailability compared to inhaled products.
What factors affect how cannabis potency translates to actual effects?
Cannabis potency effects depend on bioavailability, consumption method, individual tolerance, metabolism rate, and product formulation. Smoking provides 15-30% bioavailability while edibles offer 4-12% but longer duration. Body weight, liver function, food consumption, and previous cannabis experience all influence how potency translates to experienced effects.
How accurate are cannabis potency labels in legal dispensaries?
Licensed dispensaries must provide potency labels accurate within ±10-15% variance, verified through state-certified laboratory testing. Quality control measures include batch testing, third-party verification, and regular compliance audits. However, storage conditions, age, and handling can affect actual potency, so proper storage and consumption timing remain important factors.
What’s the difference between THC and THCA on potency charts?
THCA (tetrahydrocannabinolic acid) is the non-psychoactive precursor found in raw cannabis, while THC is the psychoactive compound created through decarboxylation via heat. Raw flower contains mostly THCA, which converts to THC when smoked, vaped, or cooked. Total potential THC calculations include both existing THC and convertible THCA content.
| Cannabis Form | Typical Potency Range | Best Use Case |
|---|---|---|
| Flower | 15-30% total cannabinoids | Traditional smoking/vaping |
| Concentrates | 70-95% total cannabinoids | Experienced users seeking potent effects |
| Edibles | 5-10mg THC per serving | Long-lasting therapeutic effects |
| CBD Products | 10-25% CBD content | Medical benefits without psychoactive effects |